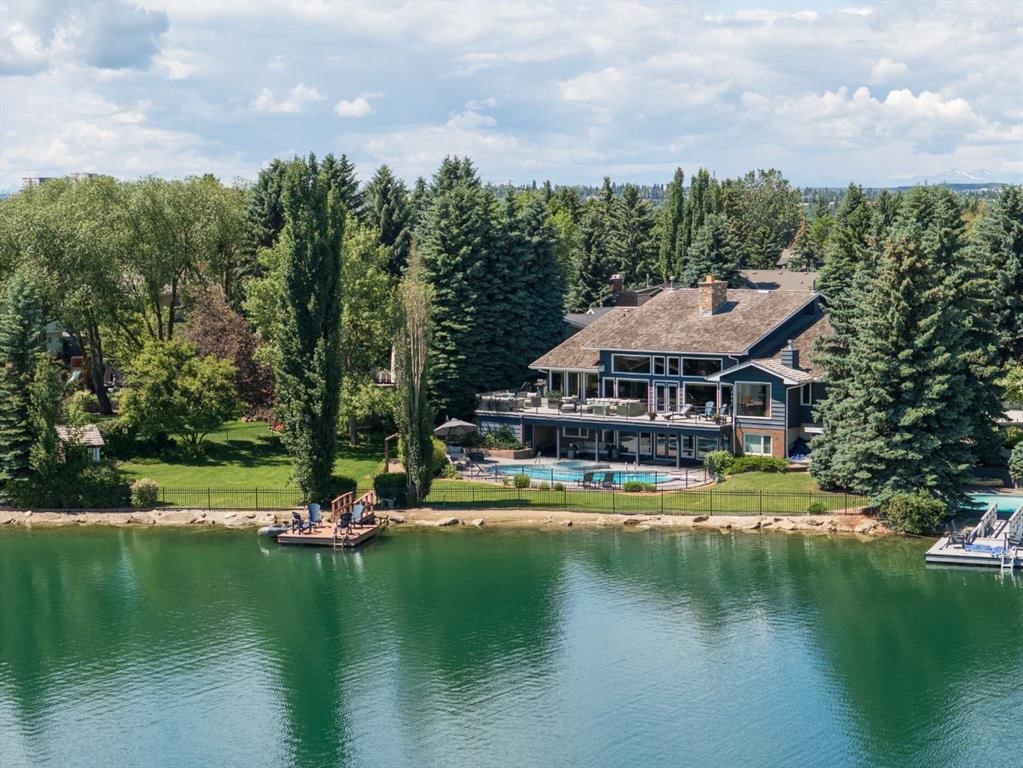
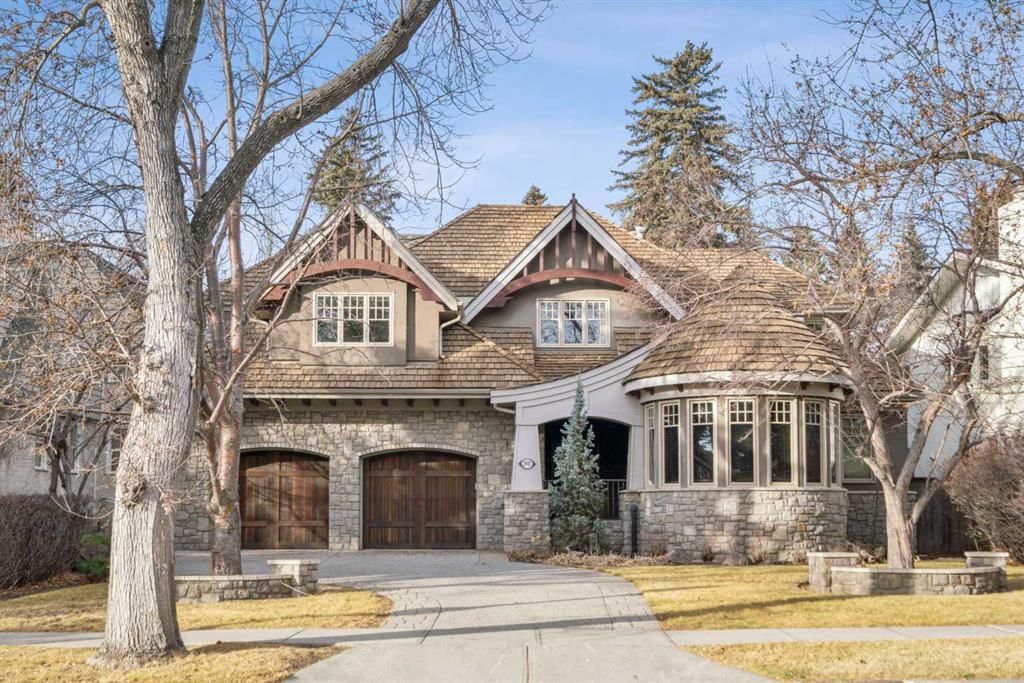
There are several homes for sale in Calgary at $1,000,000 and above right now — read live from MLS® data as this page loaded, not typed in when it was written. Below: what that threshold actually means here, where the top end trades, and what twelve months of sales data says about buying and selling into it.
Every figure in this bar is read from MLS® data when the page loads. Nothing here is stored in the page, so it cannot go stale between visits. Also on the market: several at $2,000,000 and above.
Nobody certifies a house as luxury. There is no board that rules on it and no line in the MLS® record that says so. Which means that when a site tells you it is showing you Calgary’s luxury homes, the only honest question is: above what?
This site answers it the same way on every page.
A flat price floor, applied identically across every luxury page here — homes, condos, community pages and this hub. A figure quoted on one page means the same thing as a figure quoted on another, and you can check any of them against the live search.
It is a deliberately blunt instrument, and it is worth being clear about how blunt. A million dollars buys a substantial estate home on a large lot in some parts of the city and an ordinary new infill on a 25-foot lot in others. The threshold tells you the price band; it tells you nothing about what you get for it. That is what the community sections further down are for.
Some markets set the bar at the top 10% of sales instead of a fixed number. Calgary’s $1M+ tier ran close to that over the last twelve months — 2,151 of 21,009 residential and condominium sales, or about 10.2% — so the two definitions land in broadly the same place here. A fixed number has the advantage that it does not quietly move under you between reports.
All active residential and condominium listings inside the City of Calgary at $1,000,000 and above, highest price first. Filter it down, or jump straight to a community below.
Luxury inventory is not spread evenly across Calgary. It concentrates, and it concentrates in two different ways that are easy to confuse.
Concentration is the share of a community’s sales that happen above $1,000,000. On that measure the Elbow River communities are in a category of their own: in Elbow Park, almost everything that changes hands is a million-dollar sale. Volume is the raw number of $1M+ sales, and on that measure the west side and the inner-city south are deeper — more homes trade there, so more expensive homes trade there too.
A buyer who wants to be surrounded by comparable housing should read the concentration column. A buyer who wants choice should read the volume column. They are different questions.
| Community | $1M+ sales | All sales | Share at $1M+ |
|---|---|---|---|
| Elbow Park | 57 | 59 | 96.6% |
| Upper Mount Royal | 38 | 42 | 90.5% |
| Elboya | 11 | 18 | 61.1% |
| North Glenmore Park | 29 | 48 | 60.4% |
| Altadore | 101 | 168 | 60.1% |
| St Andrews Heights | 15 | 26 | 57.7% |
| West Hillhurst | 63 | 133 | 47.4% |
| Aspen Woods | 80 | 169 | 47.3% |
| Parkdale | 26 | 57 | 45.6% |
| Richmond | 57 | 132 | 43.2% |
Ranked by share of sales at $1,000,000 and above. MLS® sold data for September 2025 – August 2026, covering only communities that already have a luxury page on this site; measured 2026-09-09. Sold figures describe a closed twelve-month window and are fixed for that window — the live counts elsewhere on this page are not.
There are two pieces of folk wisdom about expensive homes that almost every buyer arrives with: that they sit on the market longer, and that there is more room to negotiate because the number is bigger. Both are testable. Over the last twelve months on Calgary’s west side — the city’s deepest block of $1M+ inventory, and enough sales to say something meaningful — neither held.
They did not sit longer. West-side homes selling at $1,000,000 and above took a median of 20 days, against 23 days for west-side sales at every price. The average is longer at the top end, because a handful of listings sat for the better part of a year and pull the mean up. The median is the number that describes what a typical sale did.
They did not give up more room. $1M+ sales closed at a median of 98.3% of list price; sales at all prices closed at 98.1%. That is a fraction of a percent, in the opposite direction from the assumption. These are computed per property and then taken as a median — dividing one aggregate median by another is a different statistic and a more flattering one, so it is not what was done here.
None of that means an individual overpriced listing will not sit, or that a motivated seller will not move. It means the price band alone does not predict either one, and budgeting on the assumption that it does is budgeting on folklore.
Where the top end genuinely diverges from the wider market is timing. Over the same twelve months, monthly $1M+ closings across Calgary ran from a low of 98 in December 2025 to a high of 265 in June 2026 — a 2.7× swing between the quietest and busiest month. The market as a whole swung 1.9× over the same window. The luxury tier’s share of all sales moved with it, from 8.3% in November 2025 to 12.1% in June 2026.
Practically: a seller at this level gets the deepest buyer pool in late spring and early summer, and a thin one in December and January. A buyer gets the reverse. That is a real, measurable edge, and it is worth more than any of the assumptions it replaces.

Grouped by where they sit in the city. The sales figure under each is $1M+ closings over September 2025 – August 2026; the green line is live inventory right now.
The oldest concentration of large-lot housing in the city, on and around the river south-west of downtown. This is where the $1M+ share stops being a segment of the market and becomes the market.
Marda Loop and the streets around it, where the luxury tier is mostly new infill on established lots rather than estate acreage.
Newer estate and executive housing between Sarcee Trail and the city limits. The deepest single block of $1M+ inventory in Calgary.
The infill belt above the Bow — walkable to the river pathways, the university and downtown, and priced accordingly.
Riverfront condo inventory in Eau Claire, and the character-home pockets east and north-east of the core.
The $1M+ market in depth — sales, medians and supply by price tier.
How a purchase at this level actually runs, from financing to possession.
$1M+ apartment and attached inventory, and what to check in the documents.
The tier above this one, where supply is thin and timing matters most.
The 27-community west side in one search — Calgary’s deepest $1M+ block.
The whole market, for the context every luxury figure needs.
More in the Calgary real estate answers library.
Alberta operates under designated agency. Your representation comes from a specific named individual at a brokerage rather than from the brokerage as an institution, and that person owes their duties to you personally. Where two people at the same brokerage are designated to opposite sides of a transaction, each continues to represent only their own client. At this price point the question is worth asking directly — who is designated to me, and is it in writing?
Sold prices, previous list prices and property history are visible on this site behind a free registered account. That gate exists because Alberta MLS® licensing requires it for that category of data, not because the information is being charged for. Registration is free and takes a moment, and it applies across the whole site once you have it.
Live counts and the snapshot bar are read from MLS® data at page load. The twelve-month figures — the community table, the days-on-market and sale-to-list comparison, the seasonality range — are measured from MLS® sold data for September 2025 – August 2026 and describe a window that has closed. They cover residential and condominium sales inside the City of Calgary; commercial sales are excluded, because a warehouse trading above a million dollars is not what this page is about. Where a figure could not be verified it is not on this page.
There is no official designation and no governing body that certifies a home as luxury. This site uses a flat threshold of $1,000,000 and above, applied the same way on every page, so that a figure quoted here means the same thing as a figure quoted anywhere else on the site. A defined threshold you can check is more useful than an adjective. It is also a blunt instrument: $1,000,000 buys a substantial estate home in some communities and an ordinary infill in others, which is exactly why the community pages below matter more than the citywide number.
The count is read live from MLS® data every time this page loads, so it is current rather than a figure typed in on the day the page was written. It appears at the top of this page and covers residential and condominium listings inside the City of Calgary at $1,000,000 and above.
By share of sales, Elbow Park and Upper Mount Royal are the most concentrated in the city — almost everything that trades there trades above $1,000,000. By raw volume the west side is deeper: Altadore, West Springs, Aspen Woods and Springbank Hill each closed dozens of $1M+ sales over the last twelve months. Concentration and volume are different questions and the answer to one is not the answer to the other.
Measured over the last twelve months, no. West-side homes that sold at $1,000,000 and above took a median of 20 days, against 23 days for west-side sales at every price. The averages are dragged up at the top end by a small number of listings that sat a very long time, which is why the median is the more honest number to quote. The expectation that expensive homes sit longer is reasonable, and over this window it did not hold.
Over the same twelve months, no meaningful difference. West-side $1M+ sales closed at a median of 98.3% of list price; west-side sales at all prices closed at 98.1%. Those are computed per property and then taken as a median, not as a ratio of two aggregate figures. If you are budgeting for a large discount at the top end because the price is large, the data does not support it.
Seasonality is the one place the luxury market genuinely behaves differently. Over the last twelve months, monthly $1M+ closings ran from 98 in December 2025 to 265 in June 2026 — a 2.7× swing between the quietest and busiest month. The market as a whole swung 1.9× over the same window. Sellers get the deepest buyer pool in late spring and early summer; buyers face the least competition in December and January.
Sold prices and property history sit behind a free registered account because Alberta MLS® licensing requires it, not because the information is being sold. Registration is free, takes a moment, and once you have an account the sold data is visible across the site.
Alberta operates under designated agency. Your representation comes from a specific named individual, not from the brokerage as a whole, and that designated agent owes you their duties personally. If two people at the same brokerage are designated to the two sides of a deal, each still represents only their own client. Ask who is designated to you and get the answer in writing.
Whether you are buying into one of these communities or deciding when to bring a home to market, the useful conversation starts with your specific street and your specific timing — not with a citywide median.