Current West Calgary listings at $1,000,000 and up
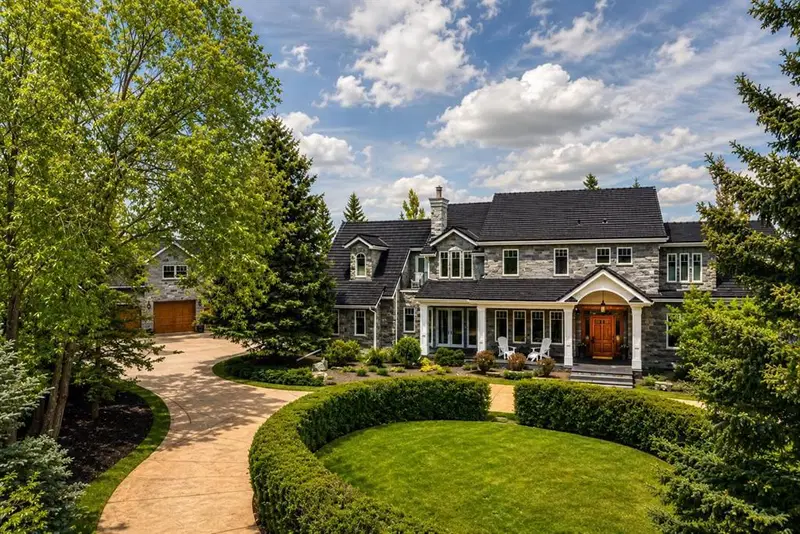 $8,995,0006 Aspen Ridge Lane SW
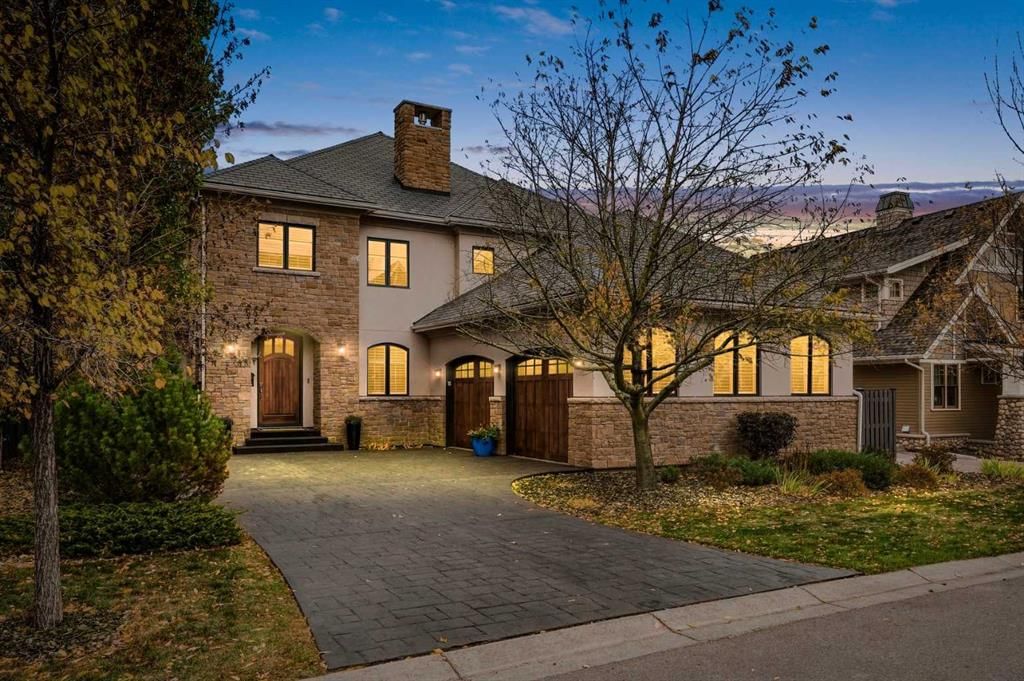 $3,600,00066 Mary Dover Drive SW
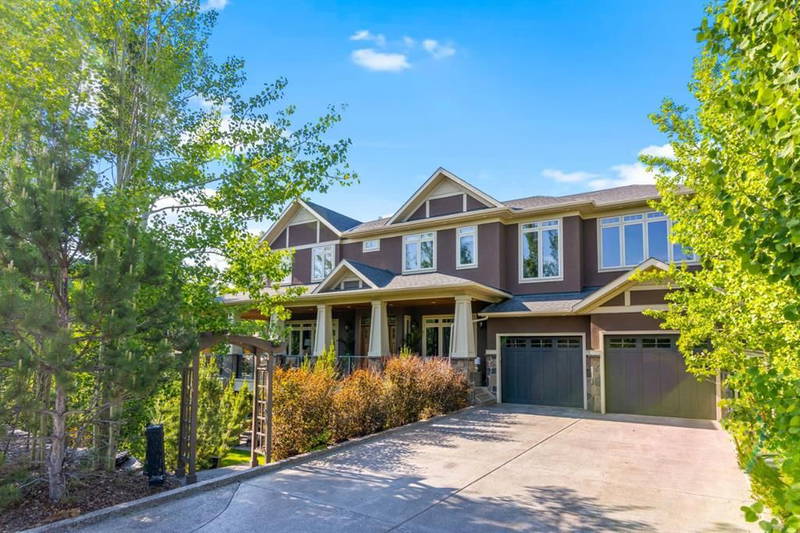 $3,500,000108 Posthill Drive SW
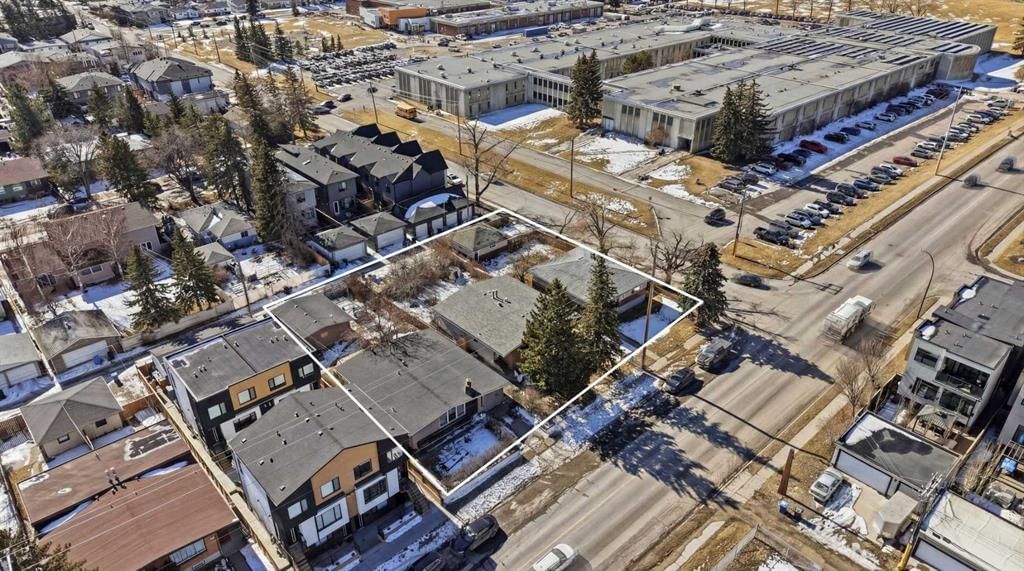 $3,450,0002135, 2139, 214 50 Avenue SW
 $3,450,0002917 Lindstrom Drive SW
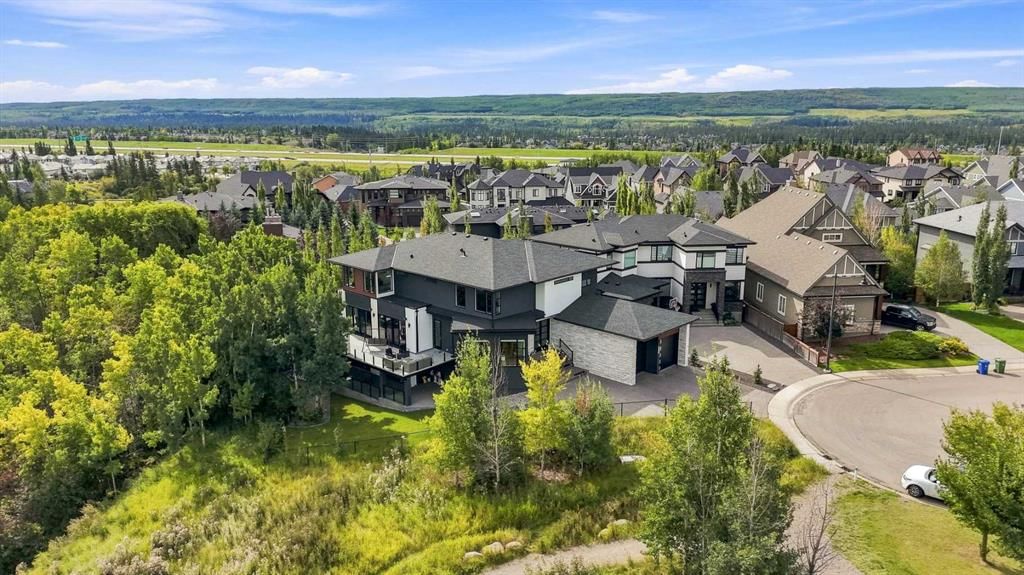 $3,350,000234 Fortress Bay SW
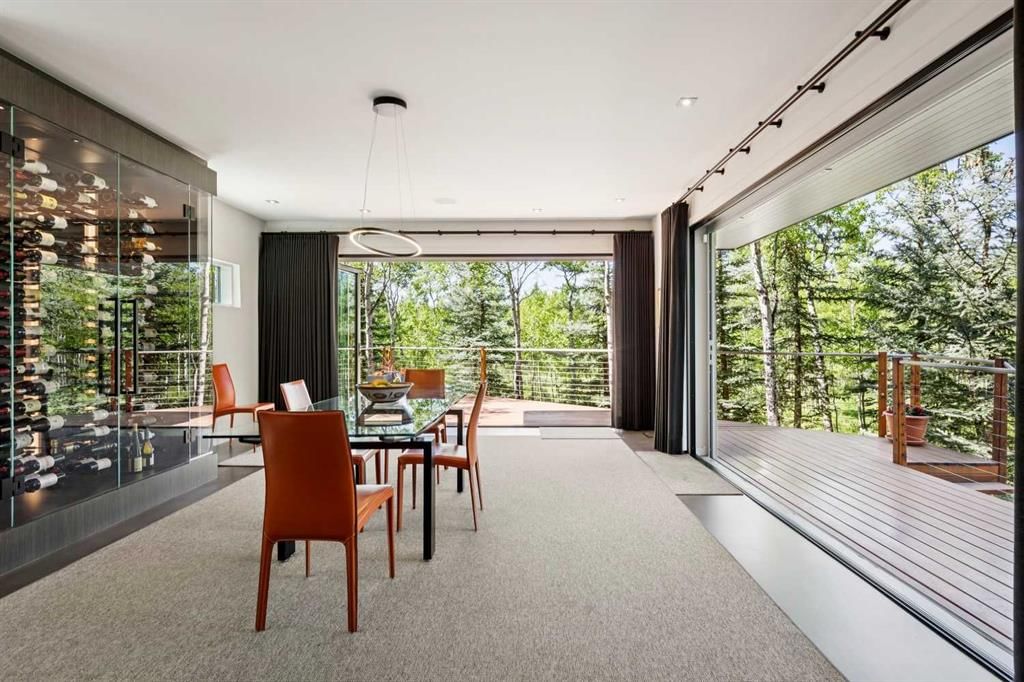 $3,100,00025 Posthill Drive SW
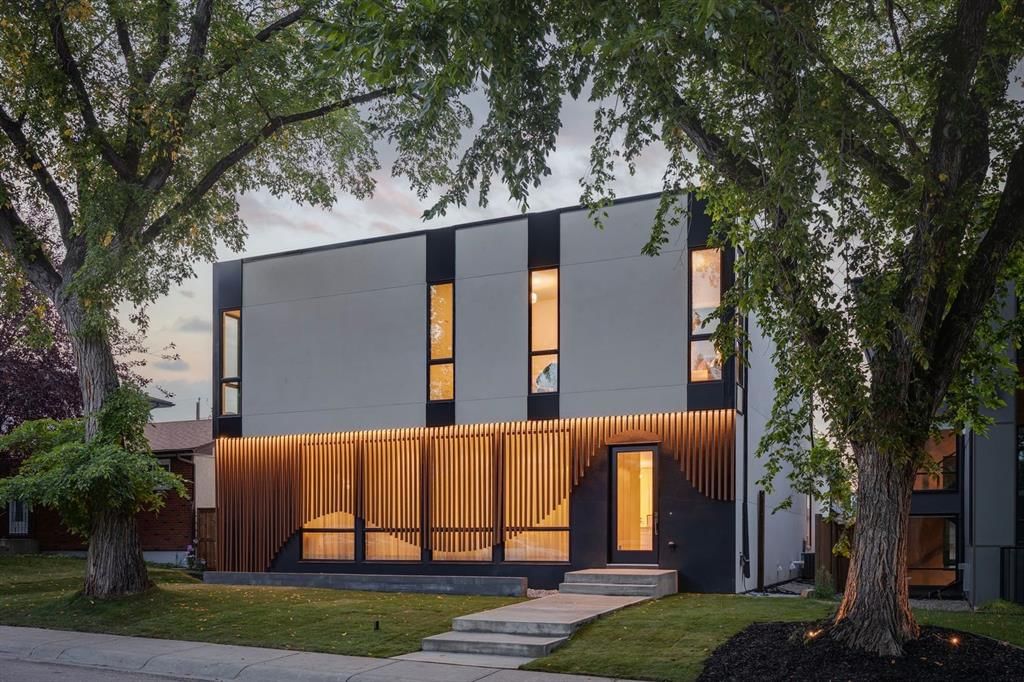 $2,999,00014 Lissington Drive SW
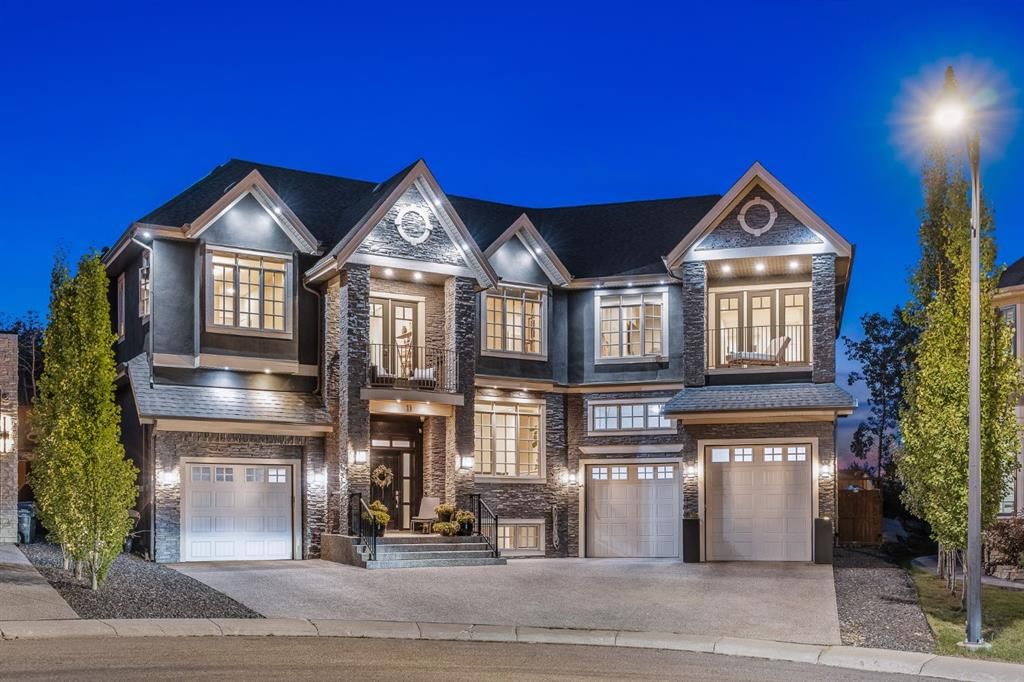 $2,995,00011 Elveden Place SW
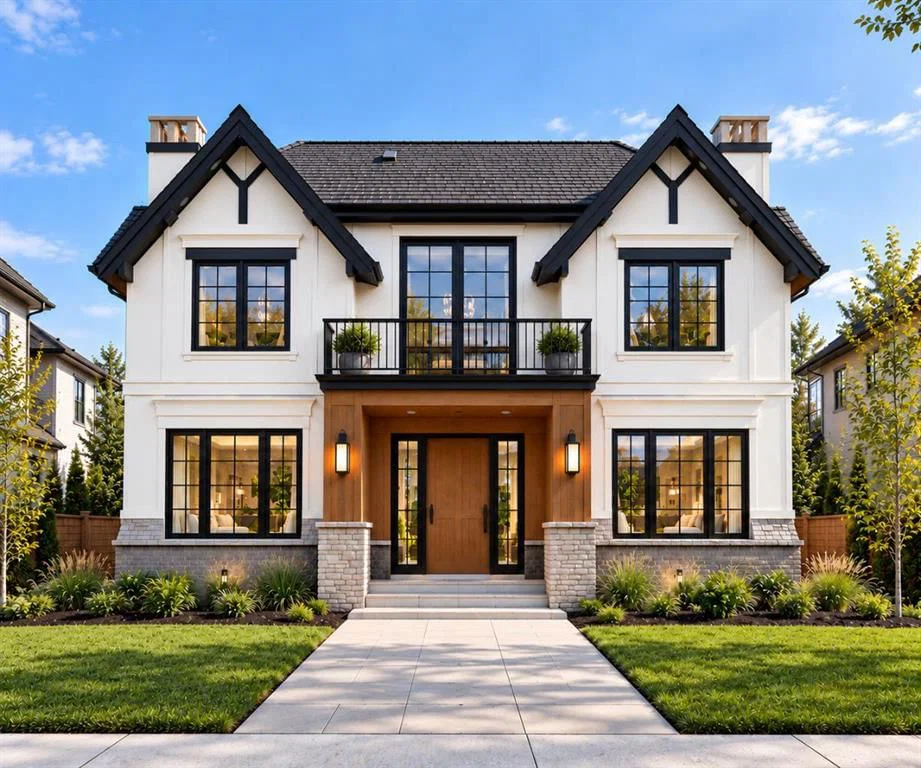 $2,985,0002019 52 Avenue SW
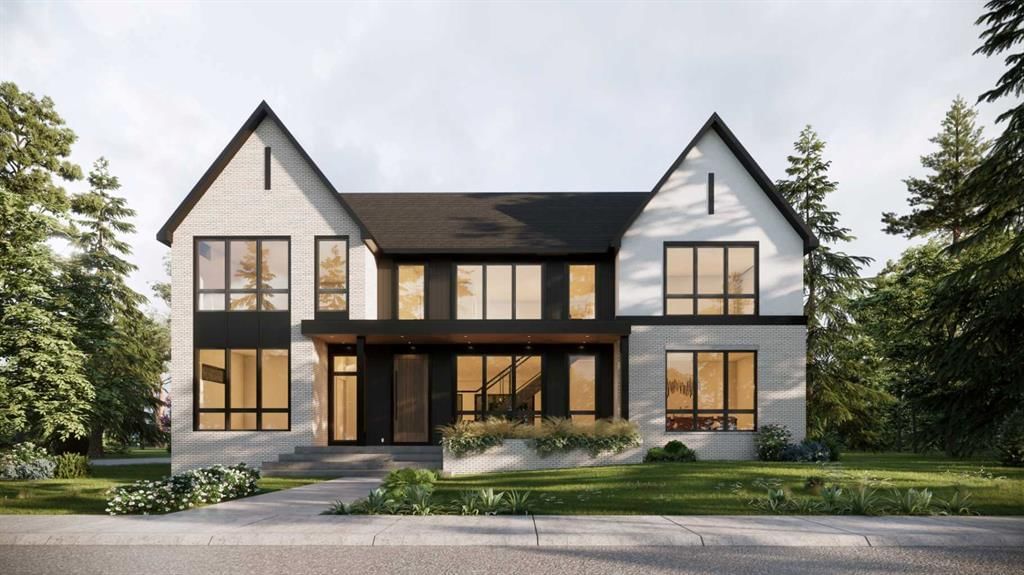 $2,975,0005831 Lodge Crescent SW
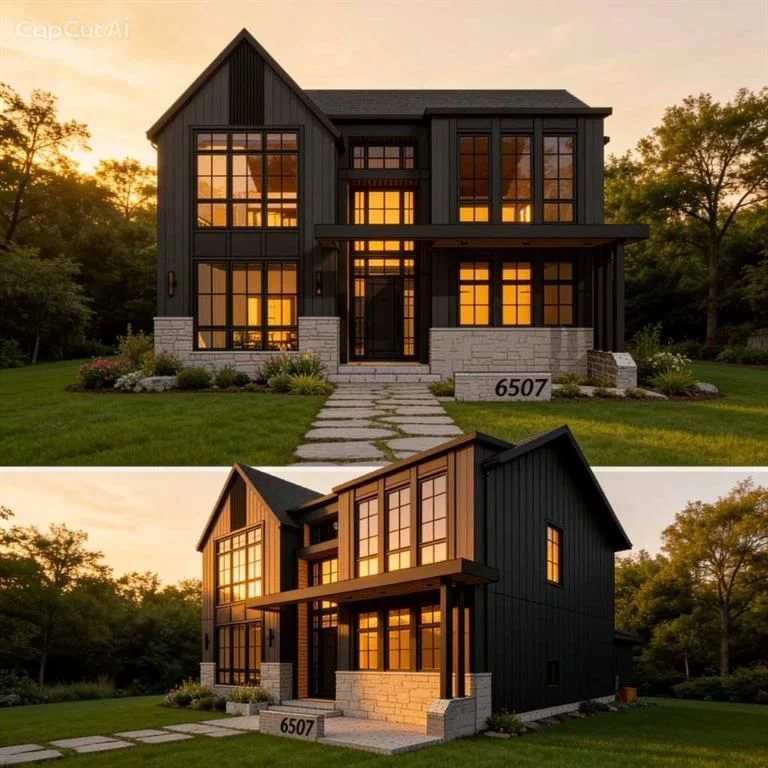 $2,950,0006507 34 Street SW
Showing 12 of 143 matching active MLS® listings in West Calgary · $1M+.
More homes for sale in West Calgary · $1M+
- 47 Langton Drive SW · $2,850,000 · 2 bed · Detached
- 6511 Law Drive SW · $2,849,900 · 4 bed · Detached
- 2708 Lougheed Drive SW · $2,799,500 · 3 bed · Detached
- 5659 19 Street SW · $2,699,900 · 3 bed · Detached
- 3508 Spruce Drive SW · $2,699,000 · 3 bed · Detached
- 82 Valour Circle SW · $2,690,000 · 2 bed · Detached
- 3642 85 Street SW · $2,500,000 · 5 bed · Detached
- 3308 Rutland Road SW · $2,500,000 · 4 bed · Detached
- 2631 63 Avenue SW · $2,490,000 · 3 bed · Detached
- 3743 36 Avenue SW · $2,398,800 · 2 bed · Detached
- 427 Patterson Boulevard SW · $2,265,000 · 4 bed · Detached
- 2034 52 Avenue SW · $2,239,000 · 4 bed · Detached
- 15 Normandy Lane SW · $2,195,900 · 1 bed · Semi Detached (Half Duplex)
- 3511 34 Avenue SW · $2,170,000 · 4 bed · Detached
- 3 Mystic Ridge Way SW · $2,145,000 · 4 bed · Detached
- 3002, 99 Spruce Place SW · $2,100,000 · 3 bed · Apartment
- 407 Patterson Boulevard SW · $2,000,000 · 4 bed · Detached
- 95 Lissington Drive SW · $2,000,000 · 2 bed · Detached
- 49 Aspen Ridge Green SW · $1,995,000 · 4 bed · Detached
- 23 Elveden Park SW · $1,995,000 · 3 bed · Detached
- 50 Posthill Drive SW · $1,950,000 · 3 bed · Detached
- 16 Spring Valley Lane SW · $1,899,000 · 2 bed · Detached
- 50 Elmont Close SW · $1,898,000 · 4 bed · Detached
- 62 Christie Estate Terrace SW · $1,895,000 · 4 bed · Detached
- 168 Posthill Drive SW · $1,890,000 · 4 bed · Detached
- 62 Posthill Drive SW · $1,880,000 · 3 bed · Detached
- 2724 Signal Ridge View SW · $1,849,999 · 3 bed · Detached
- 2223 Glenwood Drive SW · $1,799,900 · 4 bed · Detached
- 4 Aspen Cliff Close SW · $1,799,900 · 3 bed · Detached
- 40 Crestridge Heights SW · $1,792,900 · 3 bed · Detached
- 32 Spring Creek Point SW · $1,790,000 · 3 bed · Detached
- 8243 Fortress Drive SW · $1,775,000 · 3 bed · Detached
- 30 Ascot Crescent SW · $1,770,000 · 3 bed · Detached
- 60 Hong Kong Road SW · $1,750,000 · 4 bed · Detached
- 3D Willow Crescent SW · $1,750,000 · 3 bed · Detached
- 4612 Grove Hill Road SW · $1,749,900 · 4 bed · Detached
- 336 Normandy Drive SW · $1,740,000 · 3 bed · Detached
- 132 Aspenshire Drive SW · $1,724,900 · 3 bed · Detached
- 103 Elveden Court SW · $1,698,800 · 1 bed · Semi Detached (Half Duplex)
- 14 Wexford Way SW · $1,695,000 · 4 bed · Detached
- 75 Wentworth Terrace SW · $1,688,000 · 3 bed · Detached
- 11 Aspen Vista Way SW · $1,680,000 · 3 bed · Detached
- 63 Prominence Point SW · $1,680,000 · 1 bed · Semi Detached (Half Duplex)
- 87 Coulee Way SW · $1,650,000 · 2 bed · Detached
- 9318 14 Avenue SW · $1,629,900 · 4 bed · Detached
- 3A Willow Crescent SW · $1,625,000 · 3 bed · Detached
- 5 Aspen Meadows Park SW · $1,599,000 · 5 bed · Detached
- 386 Spring Creek Circle SW · $1,588,888 · 3 bed · Detached
- 65 Aspen Ridge Crescent SW · $1,575,000 · 1 bed · Detached
- 32 Aspen Vista Way SW · $1,569,800 · 3 bed · Detached
- 2004 51 Avenue SW · $1,549,900 · 3 bed · Detached
- 174 Aspen Vista Way SW · $1,549,900 · 3 bed · Detached
- 38 Lissington Drive SW · $1,524,900 · 3 bed · Detached
- 56 Patterson Crescent SW · $1,499,000 · 3 bed · Detached
- 2020 51 Avenue SW · $1,499,000 · 3 bed · Detached
- 153 Wedgewood Drive SW · $1,498,400 · 3 bed · Detached
- 123 West Grove Rise SW · $1,480,000 · 2 bed · Detached
- 12 Patina Hill SW · $1,475,000 · 2 bed · Detached
- 460 Discovery Place SW · $1,449,900 · 4 bed · Detached
- 18 West Point Mews SW · $1,449,500 · 3 bed · Detached
What West Calgary’s million-dollar market is actually made of
There are several listings at or above one million dollars across the west side right now: several detached houses, and several apartments and row/townhouses. Those figures are read live from the MLS® feed each time this page loads, so they will not match a screenshot taken last week.
It is overwhelmingly a detached market
Over September 2025 to August 2026, 556 west-side homes sold at or above one million dollars. 499 of them — 90% — were detached houses. If you are shopping the west side at this level you are, with a small number of exceptions, shopping detached houses, and it is worth knowing that before you set the filters.
The largest of those exceptions is the attached house. 35 semi-detached and full-duplex homes cleared a million dollars over the window, across 10 communities and led by Glenbrook, Rosscarrock and Springbank Hill. Two quite different products sit inside that one number: new attached infill on redeveloped lots in the older inner-west communities, and half-duplex villas in the newer estate pockets, where the appeal is a lock-and-leave footprint rather than a smaller price. They are not substitutes for each other, and the MLS® property type does not tell them apart.
The condominium and townhouse end is small and concentrated
21 apartment and row/townhouse sales cleared a million dollars over the whole twelve months, across 9 distinct addresses, and they were concentrated in West Springs, Aspen Woods, Patterson and Strathcona Park. That is not a market you can shop the way you would shop detached inventory: in practice it means waiting for the right unit in a known building rather than choosing between several this month. It is also why this site has no separate west-side luxury condo page — there is not enough there to fill one honestly. Calgary luxury condos covers the segment city-wide, where the inventory actually is.
What a million dollars buys here, and what two million buys
The most useful thing about a flat threshold is that it lets you see the ladder above it. These are the medians for what actually sold in each band over the window — not what was asked, and not what is listed today.
| Price band | Sales | Median size (sq ft) | Median $/sq ft | Median days on market | Sale to list |
|---|---|---|---|---|---|
| $1.0M – $1.5M | 363 | 2,369 | $499 | 21 | 98.3% |
| $1.5M – $2.0M | 113 | 2,994 | $568 | 16 | 98.6% |
| $2.0M – $3.0M | 58 | 3,360 | $701 | 26 | 98.2% |
| $3.0M and above * | 7 | 4,548 | $846 | 80 | 96.7% |
* Fewer than thirty sales in this band over the window — read it as the shape of a handful of transactions, not as a reliable median.
Doubling the budget buys about forty per cent more house
Move from the $1.0–1.5M band to the $2.0–3.0M band and the median home grows from 2,369 to 3,360 square feet — 42% more space — while the median price per square foot rises from $499 to $701, or 40% more. Roughly speaking, the second million does not buy twice the house: it buys about forty per cent more of it, at about forty per cent more per square foot. The difference is finish, lot, site and outlook, which is exactly the part of a home that square footage does not measure.
How the segment behaves differently from the market around it
Three things are commonly said about buying at the top of a market: that it is slower, that there is more room to negotiate, and that it runs on its own clock. Measured over September 2025 to August 2026 on the west side, one of those is true.
It did not sit longer
West-side homes that sold at or above a million dollars took a median of 21 days from listing to sale. Everything that sold on the west side over the same window took 25. The upper end was not the slow part of this market — if anything it cleared marginally quicker, and the gap is small enough that the honest reading is “about the same”.
There was no extra negotiating room at the top
Sales at $1M+ closed at a median 98.3% of the last asking price. The west side as a whole closed at 98.1%. That is the same number for practical purposes, and it is worth saying plainly because the opposite is often assumed. Note the measurement: it is against the last asking price, so a home that was reduced twice before selling still shows a high ratio. Price reductions, not the final negotiation, are where most of the movement happens.
It is more seasonal than the market around it
This is the one that holds up. Between November and February, west-side sales at $1M+ ran about 28 a month. Between March and June they ran about 61 — a 2.1× swing. The whole west-side market swung 1.7× over the same two stretches. The top end empties out harder in winter and refills harder in spring than the market beneath it does.
For a buyer that cuts both ways: a January listing at this level is competing with far less, and a seller who lists into the spring is competing with far more. Neither is automatically the better move, but the two are not the same decision.
How big a share of the west side this actually is
25% of everything that sold on the west side over the window sold at a million dollars or more. Supply is running at 2.8 months at $1M+ against 2.7 months for the west side as a whole, on listing counts as at 2026-09-01 — meaning the balance between buyers and sellers at the top of this market is close to the balance in the market underneath it, rather than a separate world.
West Calgary luxury homes by community
The segment is not spread evenly across the west side. West Springs, Aspen Woods and Springbank Hill together took 238 of the 556 sales at $1M+ over the window — 43% of them, from three communities. Everywhere else on this list trades at this level in smaller numbers, which usually means less choice rather than better value.
Each of these is its own page, with that community’s own $1M+ listings, how its upper end trades against its own wider market, and what the housing stock at that level actually is. Counts are live.
Seeing what these homes actually sold for
Every figure on this page is built from sold data, but the individual sold prices behind it are not shown to anonymous visitors. Under the Alberta MLS® System’s VOW rules, sold prices and full property history can only be displayed to a registered user — that is a licensing requirement we operate under, not a paywall, and the account is free. Once you have one, every sold card on this site shows the price it closed at and the history behind it.
Get an evaluation of your own home, or read the Calgary Neighbourhood Report for how the west side sits against the rest of the city.
How these figures were produced
Listing counts are read live from the MLS® feed on page load. Every historical figure — the band medians, days on market, the sale-to-list ratios and the monthly counts — is measured across every west-side sale recorded between September 2025 to August 2026, using the same method on both sides of each comparison so the two are actually comparable. Days on market is measured from the list date to the sale date. Price per square foot uses the above-grade square footage in the MLS® record, which is why a home with a finished walkout reads high on it. No figure on this page is an estimate, and where a band was too thin to support a median we have said so rather than printing one. How we calculate these figures.
West Calgary here means the communities in our West Calgary hub, which follows the CREB® district rather than a straight compass line.
Want to be told when one of these comes up?
Inventory at this level is thin, and the right home can go quickly once it lists. We will set a saved search across the whole west side at your own threshold — no obligation, and you can stop it any time.
Talk to a REALTOR® All West Calgary listingsListing counts on this page are read live from the MLS® feed each time it loads. Sold figures cover September 2025 to August 2026. How we calculate these figures.